March 04, 2004
Feed polling
The 'log processing' I mentioned in the last posting is to produce data on the polling behavior of feed readers and the effectiveness of different strategies. The graphs below are just a teaser for the more extensive reporting that I will do here in the coming days.
The two graphs display the inter-arrival of times of requests for one of the rss & atom feeds coming as issued by the same user. The majority of the requests follow a strict pattern: 40% of the users pool the feed every hour, 40% more frequently than an hour and the remain 20% is spread out over a long time with some small spikes at 90 minutes, 2, 3 and 4 hours. Interpretation of this and other data will be the subject of one or more follow-up postings.
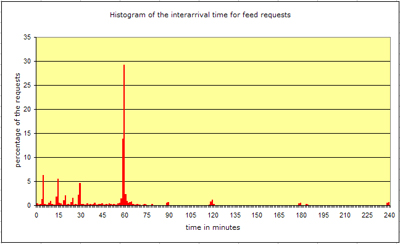
This histogram show the inter-arrival times,
with clear spikes at preset times (5, 10, 15, 30, 60, 90, etc).
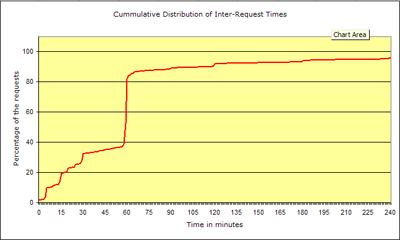
The CDF of the inter-arrival times which show that 80% of
the users
will poll the feed within an hour of a previous request.
I'd say those 6 folks polling every five minutes need a serious spanking or a sedative or something!
Posted by: McGroarty on March 5, 2004 09:58 AMThis is great stuff — keep it up.
I wanted to do this sort of analysis, but have never found the time. If you’re interested in more logs to analyse, see the traces I’ve collected; I have a few more to post, if you find them useful.
See also a blog entry a while back.
Posted by: Mark Nottingham on March 7, 2004 10:12 AM